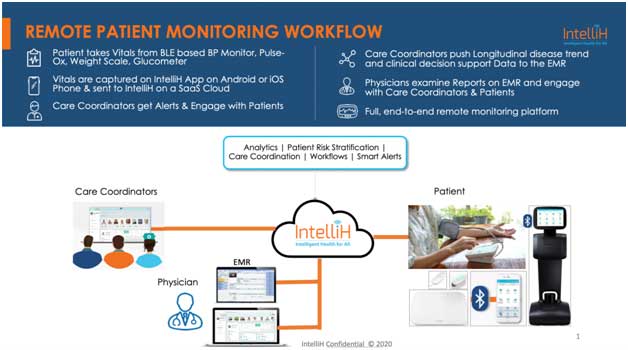
IntelliH is a robust RPM solution that manages common cardiovascular conditions through a
system of care co-ordination:
Systemic Arterial Hypertension: IntelliH tracks systolic and diastolic blood pressures through
FDA approved Bluetooth enabled blood pressure machines and provides alerts when readings are
out of range. Summary reports are available through our customizable reporting system, with
readings classified according to JNC Guidelines. Our Diet module tracks sodium intake and
provides correlations with blood pressure readings.
Congestive Heart Failure: IntelliH uses FDA approved Bluetooth enabled devices to track volume
status and hypoxia so that interventions can be provided before a risky event occurs, to avert
disease decompensation. Fluid intake can be tracked for individual patients to understand what
lifestyle decisions may be triggering adverse outcomes.
6MWT*: IntelliH provides six minute walk testing with tracking of heart rate recovery in the first
minute after exercise to capture an assessment of autonomic function. One of the earliest signs of
decompensation of Cardiopulmonary conditions like CHF and pulmonary hypertension is
autonomic dysfunction and reduced functional capacity, which is measured in our 6MWT module.
*IntelliH relies on the accuracy of the accelerometers in commonly available smart phones to
provide 6MWT results and may be prone to the errors associated with those devices.

This document reviews the physiologic rationale for using these sensors for congestive heart failure management and further describes the invasive options that exist today.
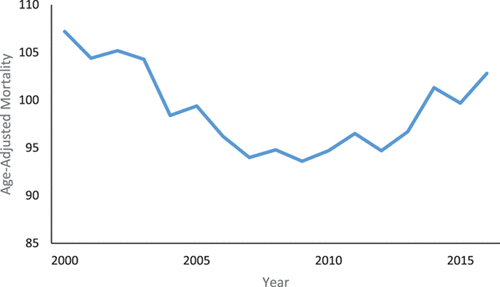
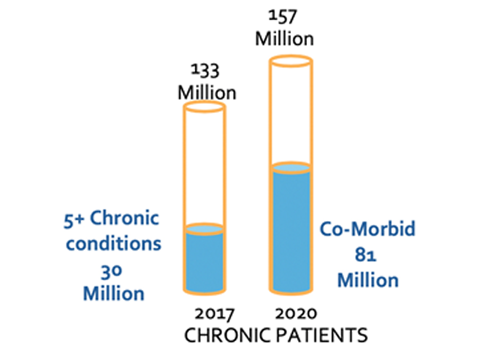
Nearly 5.7 million people in the United States have congestive heart failure and by 2030 this is expected to grow to 8 million11. Hospitalizations for CHF account for an ever-increasing rise in healthcare costs. The chronicity of congestive heart failure and the lifestyle changes that are required to manage the condition, make it an increasingly difficult disease to control. Even more challenging is that by the time patients develop symptoms, the disease is already decompensated to a critical level that can become life-threatening (figure 1).
Remote patient monitoring holds the promise of providing early warning indicators that herald the advent of disease decompensation and impending hospitalization.
This document attempts to review some of the monitoring technologies that are available that can be used for remote patient monitoring to provide a way of assessing patients so that advanced signals of disease decompensation are properly analyzed, which may help avert an adverse outcome or hospitalization (Table 1).
|
Biometric data to be measured |
Current Technology |
|---|---|
|
Weight |
Bluetooth scales |
|
Pulse oximetry |
Bluetooth enabled Pulse oximeters, Apple watch |
|
Heart sounds |
Digital stethoscopes, implanted cardiac devices |
|
Impedance |
External impedance measurements, implanted cardiac devices |
|
Filling pressures |
CardioMems |
Weight gain is used as a marker for the fluid retention and hypervolemia related to congestive heart failure.
Chaudhry et al. noted that body weight starts to increase about 1 week before hospitalization for heart failure3. Increasing amounts of weight gain is correlated directly with the increased risk for heart failure hospitalization. They noted that on average patients had gained 1.1 kg compared to baseline whereas patients in the control group who did not have hospitalizations had actually lost 0.7 kg. Almost 30% of patients hospitalized for acute heart failure had gained more than 2.2 kg before the event. They also noted that automatic scales with automatic transmission, currently being used for remote monitoring, were better than manual machines due to the better authenticity and reliability of the data being sent.
Weight gain can be present independent of external signs such as overt lower extremity edema. Central venous congestion can occur in the absence of any visible external signs. Although day-to-day variations of weight can occur for reasons other than heart failure, more than 1 kg variation is not common unless there is fluid retention4. As heart failure worsens to its more advanced stages, however, several inflammatory chemicals as well as neuroendocrine modulators circulate in the peripheral bloodstream that may cause cardiac cachexia (severe wasting of the body). Thus, as heart failure approaches its advances, weight can be a confounding measurement given that weight gain may be related to fluid retention, but weight loss may be concomitantly occurring due to the cachexia associated with advanced heart failure.

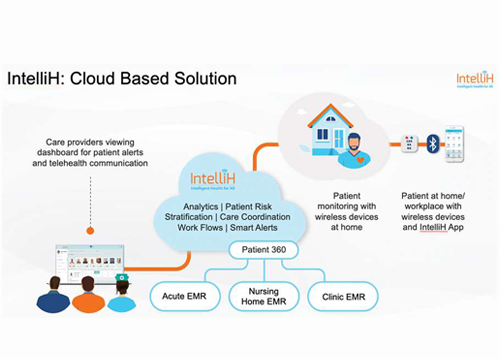
IntelliH Care Coordinator’s Dashboard
Patients capture their weight using a Blue Tooth enabled Weight scale connected to the IntelliH Patient’s App on iOS or Android devices and send that to IntelliH in the cloud. IntelliH tracks weight gain against a patient’s dry weight and generates proactive smart alerts to care coordinators when it senses abnormal or progressive weight gain
As congestive heart failure decompensates, venous congestion can occur in the thorax leading to the leakage of fluid out of the veins of the pulmonary circulation into lung tissues leading to airspace collapse. This interferes with the ability to transfer oxygen from the airspace of the lung tissue into the blood resulting in hypoxia, which is manifested as shortness of breath.
Oxygenated blood is bright red while deoxygenated venous type blood is darker red in color. The difference in the optical characteristic of oxygen rich blood versus oxygen poor blood is utilized by pulse oximetry to quantitate the amount of oxygenated blood present in the patient’s circulatory system.
Two types of pulse oximeters are currently available in the market. One utilizes transmission mode oximetry and has become the gold standard used in most healthcare facilities with the transmission of regular infrared light through tissues such as earlobes or fingers.
Depending on the oxygen characteristics of the blood the received wavelength of light on the other end of the tissue will vary quantitatively depending on the amount of oxygen rich versus poor blood (Figure 2).
Newer technology that is being used in wearables is reflective mode oximetry, which is currently being utilized in the Apple Watch, where light is transmitted to one side of the tissue and reflected back from the same side to the sensor.
Again, the wavelength of light received is dependent on the fraction of oxygenated versus deoxygenated blood (Figure 3).

IntelliH Patient’s App
A Blue tooth enabled transmission mode Pulse Oximeter wirelessly connected to the IntelliH’s Patient App on iOS and Android devices collects a patient’s SpO2 as well as their heart rate and transmits that to the IntelliH cloud where the data is analyzed to sense any decompensation
The latter has been shown to be inferior compared to the former because of confounding variables such as ambient light and the amount of pressure needed to be applied to the skin that cannot be standardized from measurement to measurement.
Figure 2.

source: https://www.amazon.in/Choicemmed-MD300C2-Pulse-Oximeter/dp/B00E3KZC42
Figure 3. Reflective mode oximetry

Source: https://www.medpagetoday.com/blogs/skeptical-cardiologist/88729
The first heart sound or S1 and third heart sound also called S3 have clinical significance in the monitoring of congestive heart failure.
The S1 heart sound corresponds to the closure of the atrioventricular valves, which are the mitral and tricuspid valves. The intensity of the sound depends on the rate of increase of intraventricular pressure during systolic contraction of the ventricles. The more forceful and vigorous the myocardial contraction the greater the pressure generated to close the atrioventricular valves and the louder the S1. In conditions that cause a cardiomyopathy, which ultimately cause congestive heart failure, there is a clinically significant drop in the rate of increase of intraventricular pressure resulting in a decreased intensity of the S1 sound7.
The third heart sound is generated after the atrioventricular valves open at the onset of diastole (figure 4).
Sudden distention of the ventricles as blood fills them in the rapid termination phase of the early diastolic period, generates a vibration that is auscultated as the S3. Any causes of decreased left ventricular function resulting in congestive heart failure with concomitant volume overload can produce a third heart sound8 as blood rapidly decelerates in a stiff left ventricle from a left atrium that has high filling pressures. Thus, the substrate for an S3, is an increase deceleration of early mitral inflow, elevated LV filling pressures and abnormal compliance of the myocardium9.
Figure 4

Four-channel phonocardiogram taken at a paper speed of 100 mm/sec. The top channel shows an electrocardiogram (EGG lead II); the second and third channels record from a single microphone placed near the cardiac apex. The cardiovascular sound is filtered so that the second channel records frequencies below 25 Hz and the third channel below 100 Hz. The fourth channel displays a carotid arterial pulse (left) and a tracing of the apex movement (right). The heart sounds are labeled I and II. A prominent ventricular gallop (VG) is recorded 0.16 second after the second heart sound. Note that it is recorded best on the low-frequency channel. A low-intensity, early to midsystolic murmur is also present (not labeled). The apex tracing shows a sustained systolic wave and a rapid early diastolic filling wave (arrow). The ventricular gallop occurs at the peak of the rapid filling wave. The examiner should simultaneously feel the carotid impulse and listen at the apex in order to time the heart sounds and gallop.Source: Silverman ME. The Third Heart Sound. In: Walker HK, Hall WD, Hurst JW, editors. Clinical Methods: The History, Physical, and Laboratory Examinations. 3rd edition. Boston: Butterworths; 1990. Chapter 24. Available from: https://www.ncbi.nlm.nih.gov/books/NBK342/
There are 2 ways to digitally record heart sounds.
Pacemaker leads have an intrinsic accelerometer that can detect endocardial vibrations and decipher them into relevant heart sounds.
External auscultation via digital stethoscopes can also record heart sounds with artificial intelligence technology to identify specific heart sounds that may be correlated with underlying congestive heart failure.
Figure 5

Peak Endocardial Acceleration (PEA) sensor (Sorin Group, Italy). An accelerometer mounted on the tip of a pacing lead placed in the right ventricle detects PEA-I, related to the isovolumic contraction (and the first cardiac tone) and PEA-II, related to the isovolumic relaxation (and the second cardiac tone).Source: Occhetta, Eraldo et al. “Usefulness of hemodynamic sensors for physiologic cardiac pacing in heart failure patients.” Cardiology research and practice vol. 2011 925653. 15 Mar. 2011, doi:10.4061/2011/925653
Figure 6
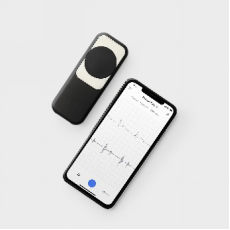
Source: https://shop.ekohealth.com/products/duo-ecg-digital-stethoscope
Impedance (also referred to as bioimpedance or biological impedance) is governed by Ohm’s law which states that resistance equals voltage divided by a measured electric current (V=IR or R=V/I). As cardiopulmonary tissues develop fluid congestion, with increased fluid content, the resistance to an applied current, decreases due to the better conductivity of water compared to air. Therefore, fluid congestion has an inverse relationship with impedance.
The 2 methods currently available for measuring impedance are the band electrode method and the implanted device placement1.
A. Band electrode method (Figure 7): External electrodes are needed with external contact to the skin. A high-frequency low amplitude current is applied between the electrodes from the neck to the thorax. More recently more compact devices to measure impedance externally, even small enough to be worn as wearables, have been developed.
B. Implanted device-based method (Figure 8):In patients with implanted electronic device such as pacemakers or cardiac defibrillators the electric field is measured between the pacing device itself and the tip of the pacing electrode. As fluid accumulates there is a better electric circuit due to reduced resistance; this provides an avenue for the longitudinal assessment of congestive heart failure.
Although impedance from implanted devices is a useful surrogate for congestion it is known that impedance can be affected by other parameters and therefore there are high false positive rates. Impedance from implanted devices should be used in conjunction with clinical data for the assessment of congestive heart failure and tracking potential disease decompensation. Impedance though does have some level of prognostic capability and there is data to suggest a potential mortality association as impedance changes2.
Longitudinal impedance assessment is particularly useful for population based clinical risk assessment; patients with relatively low impedance seem to be at high risk compared to those with medium or high impedance. Therefore, patients with low impedance may require more clinical resources to follow them in order to avoid more rapid disease decompensation.
Figure 7
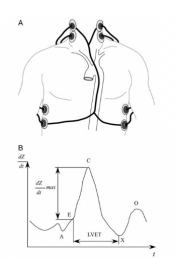
Band electrode impedance measurement.
A, Schematic representation of the band electrode technique.
B, Time derivative impedance dZ/dt plotted against time t. Point A marks the fourth heart sound of atrial contraction, point B signals the first heart sound before ventricular isovolumetric contraction and rapid ejection, point C is the maximum dZ/dt, point X is the second heart sound of the closing aortic valve, and point O marks the diastolic filling. Left ventricular ejection time (LVET) is the time between points B and X.
Figure 8

Implanted electrode impedance measurement.
A, Schematic representation of the implanted electrode technique.
B, Plot of the impedance Z for device-based fluid monitoring for a hypothetical episode of fluid overload. Point B is the baseline impedance in the absence of fluid overload, point C marks the steady decline in impedance with accumulating pulmonary fluid over several days or weeks given by Δt, and point D follows the restoration of baseline impedance ΔZ with applied diuretic therapy.
Tang WH, Tong W. Measuring impedance in congestive heart failure: current options and clinical applications. Am Heart J. 2009;157(3):402-411. doi:10.1016/j.ahj.2008.10.016
Implanted cardiac devices incorporate impedance data into an algorithm that provides a composite index using multiple parameters to develop a more sensitive measurement of the propensity for decompensation of CHF. There are some examples from some of the major device companies:
1. Boston Scientific Heart Logic algorithm:
Figure 9
Boston Scientific Heart Logic algorithm

A 74‐year‐old man with non‐ischemic dilated cardiomyopathy, 22% ejection fraction, left bundle brunch block, and persistent atrial fibrillation was implanted with a cardiac resynchronization therapy defibrillator for primary prevention on May 2017 (Table 2,2, event 15). During follow‐up on 1 November 2017 (red line), he discontinued diuretic therapy. At a subsequent in‐office medical control on 4 December 2018, he reported weight gain of 4 kg within 7 days; therefore, diuretic therapy was restored (green line). HeartLogic index analysis showed crossing of the alarm threshold value already on 25 November 2017 (blue line) with thus an early warning 10 days in advance compared with clinical evaluation. That index normalized after therapy restoration. Main sensor contributing were heart sounds and thoracic impedance.
Capucci A, Santini L, Favale S, et al. Preliminary experience with the multisensor HeartLogic algorithm for heart failure monitoring: a retrospective case series report. ESC Heart Fail. 2019;6(2):308-318. doi:10.1002/ehf2.12394
Figure 10 Medtronic
Medtronic OPTIVOL 2.0 Cardiac Compass Report:
OPTIVOL 2.0 TRENDS ARE VIEWABLE ON THE CARDIAC COMPASS™ REPORT

One of the earliest indicators of worsening congestive heart failure is the increase in filling pressures in the great vessels of the heart. The CardioMEMS heart failure system from St .Jude, takes advantage of this pathophysiology by permanently implanting a small sensor in the pulmonary artery via a right heart catheterization procedure to assess, via a transducer, changes in fluid dynamics and pulmonary pressures that might herald the increase in filling pressures that ultimately may result in disease decompensation and CHF. Readings from the sensor are transmitted to an electronic CareLink system that relays data to the managing physician for real-time management of the patient. The components of the system are described in the diagram below.
Figure 11

System Components
The CardioMEMS HF System includes the following components:
Implantable PA sensor
Delivery catheter
Patient electronics system and antenna
Hospital electronics system and antenna, used by clinicians during sensor implant and at hospital checkups
Secure web portal (Merlin.net™ Patient)

Congestive heart failure is a burdensome disease with high morbidity and mortality that is challenging to manage. As the population ages and a significant number of patients develop congestive heart failure, particularly with preserved ejection fraction (HFpef) that has limited treatment options, remote patient monitoring, with its ability to extend the perimeter of the health care system to the patient’s home, becomes increasingly important. By utilizing current technology that makes use of the underlying pathophysiology of the disease and uses a variety of relevant biometric data markers as an early warning system, remote patient monitoring can satisfy the promise of appropriately applied technology to rein in a disease that otherwise would be huge weight on the health care system.
2020: © IntelliH and/or its affiliates all rights reserved. IntelliH and the IntelliH logo are trademarks or registered trademarks of IntelliH and/or its affiliates in the U.S. and other countries. Third-party trademarks mentioned are the property of their respective owners.
Share This blog